At Skvare we host a diverse set of clients, with varying performance characteristics, this unpredictability increases the importance of monitoring in order to be aware of changes as they occur.
Skvare has a mix of common industry tools, along with bespoke internal tools used for monitoring. We take an approach of using common industry tools when possible, and when they don't fit our needs we develop our own solutions.
Infrastructure monitoring
To monitor server performance metrics we use a centralized prometheus instance, paired with grafana for visualization, and netdata for server monitoring. Additionally we deploy Monit with custom metrics and alerting.
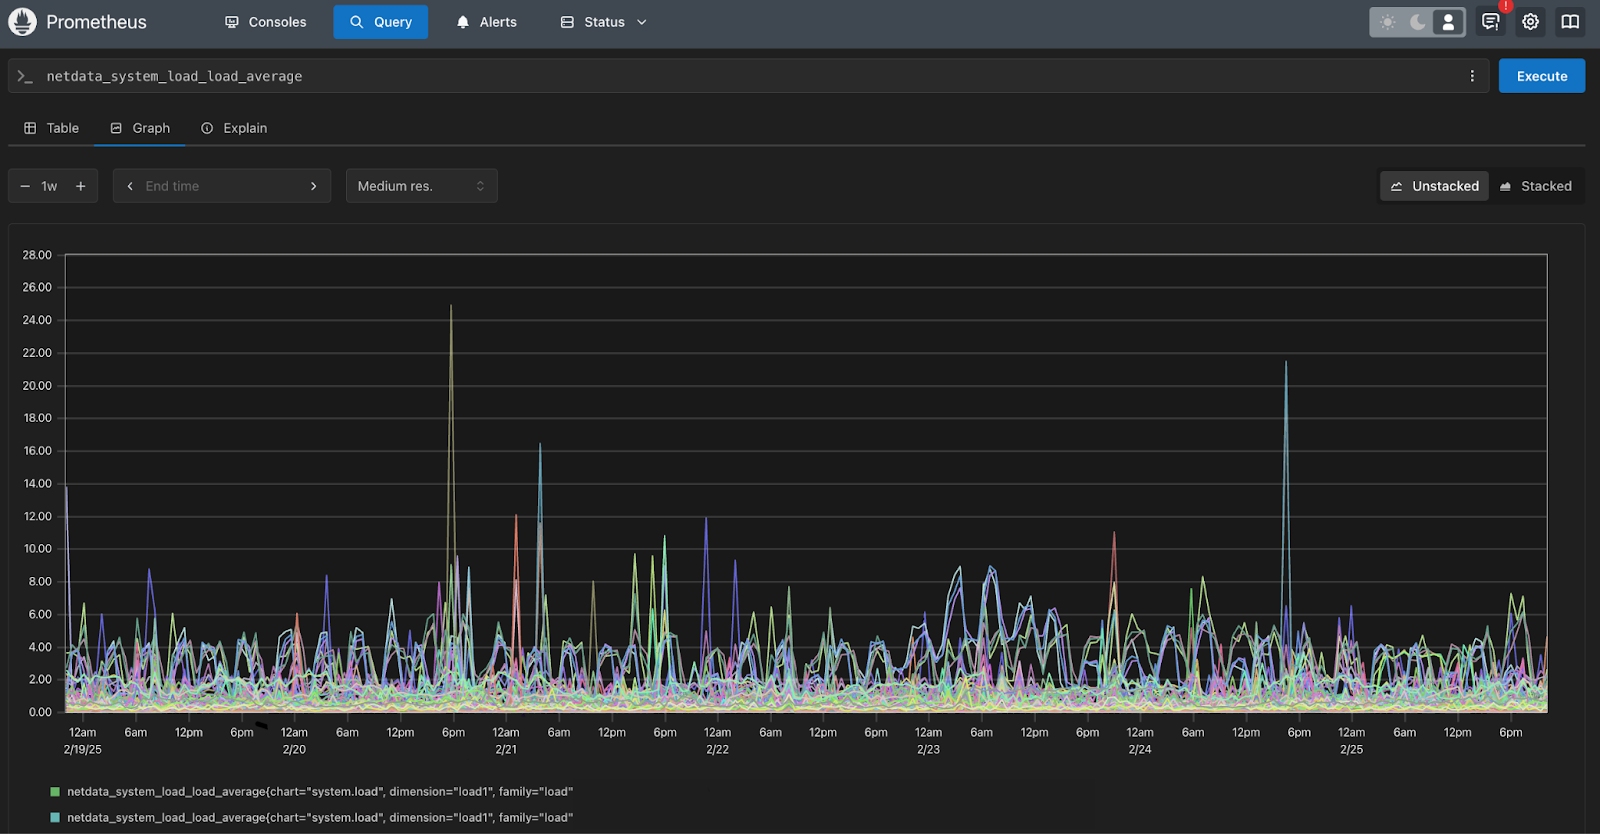
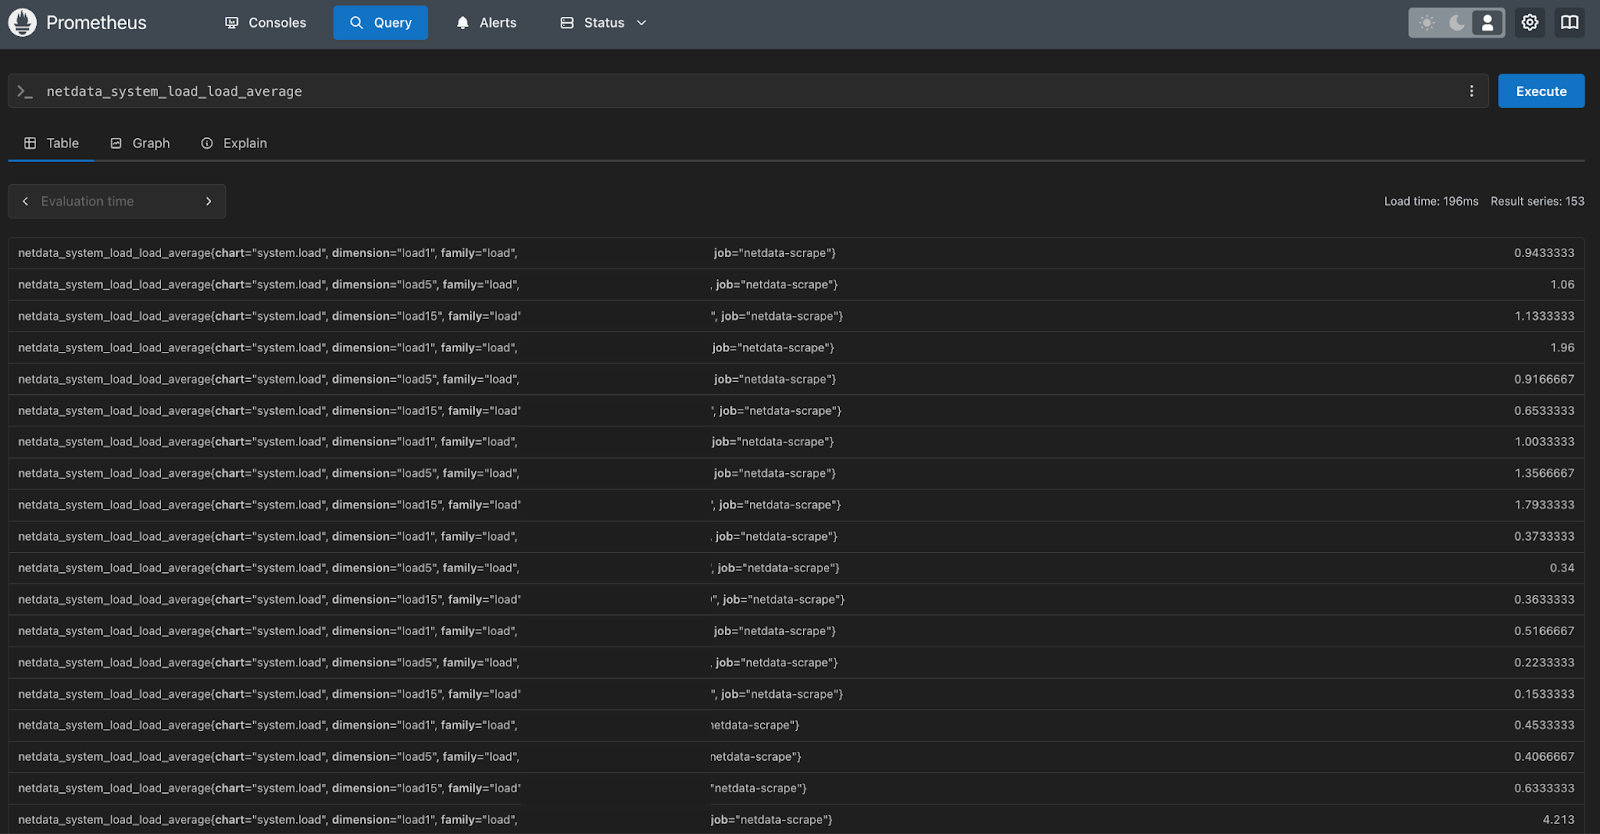
For storing long-term time series data we take advantage of Prometheus, this allows us to look back at history in order to investigate trends, and estimate future requirements.

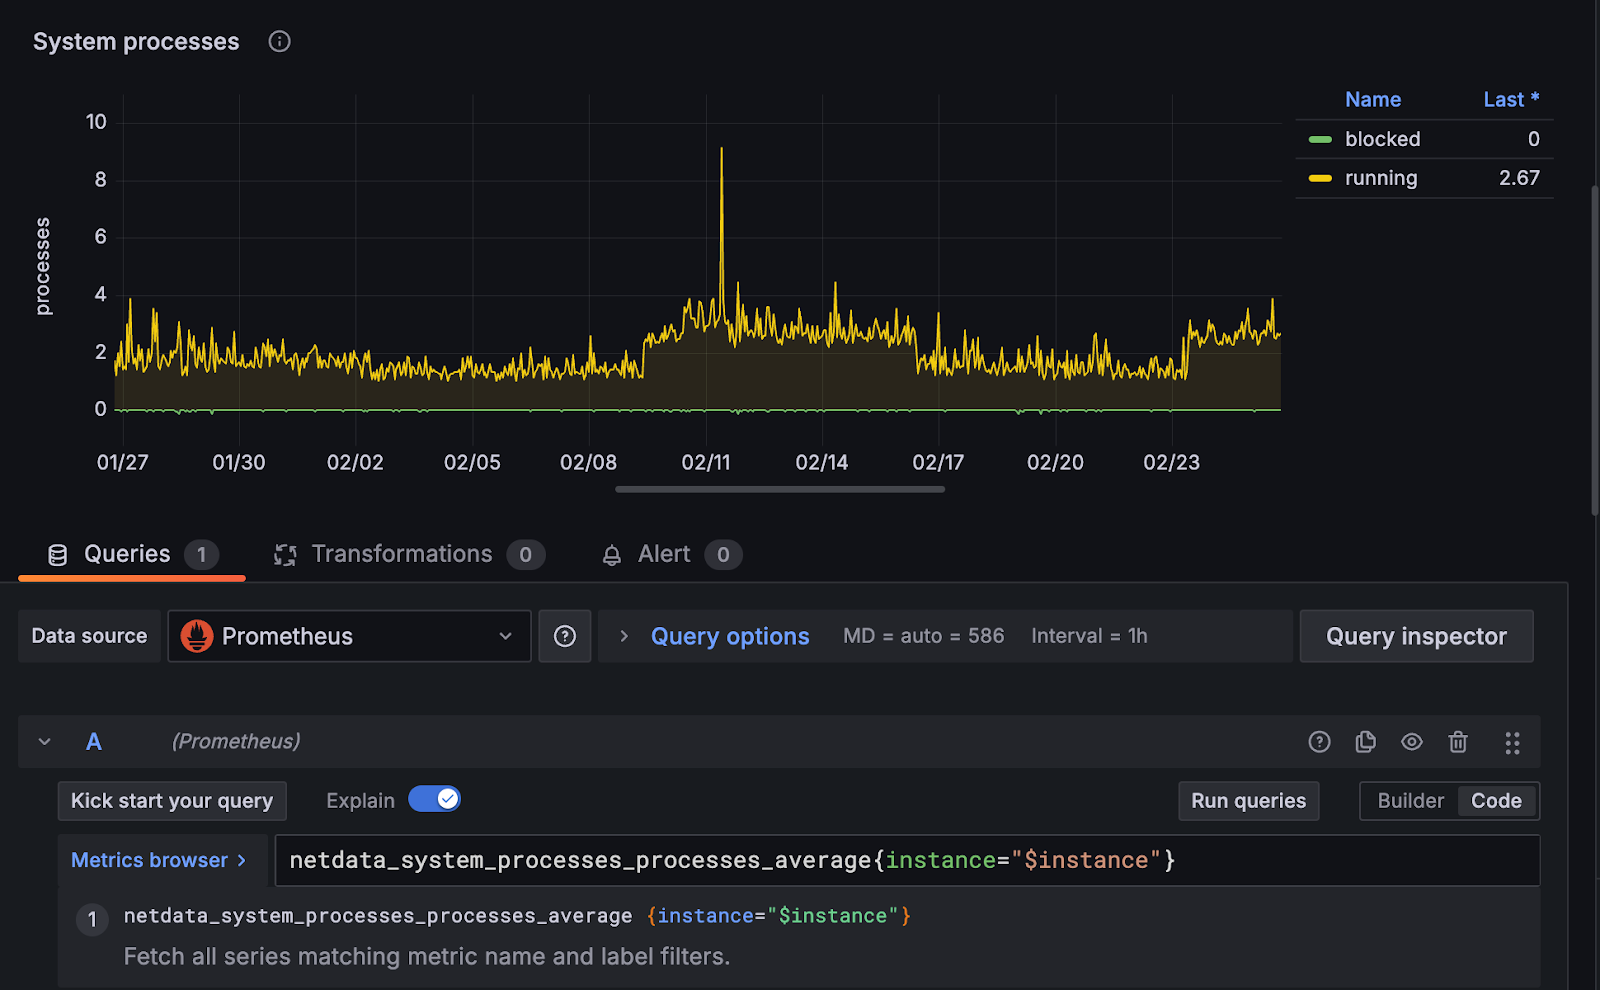
For visualization we use grafana, which provides a very customizable interface allowing us to separate collection from visualization.
For example, we can take the CPU metrics we have gathered from various servers and display them in the way we would like to see them using a simple query:


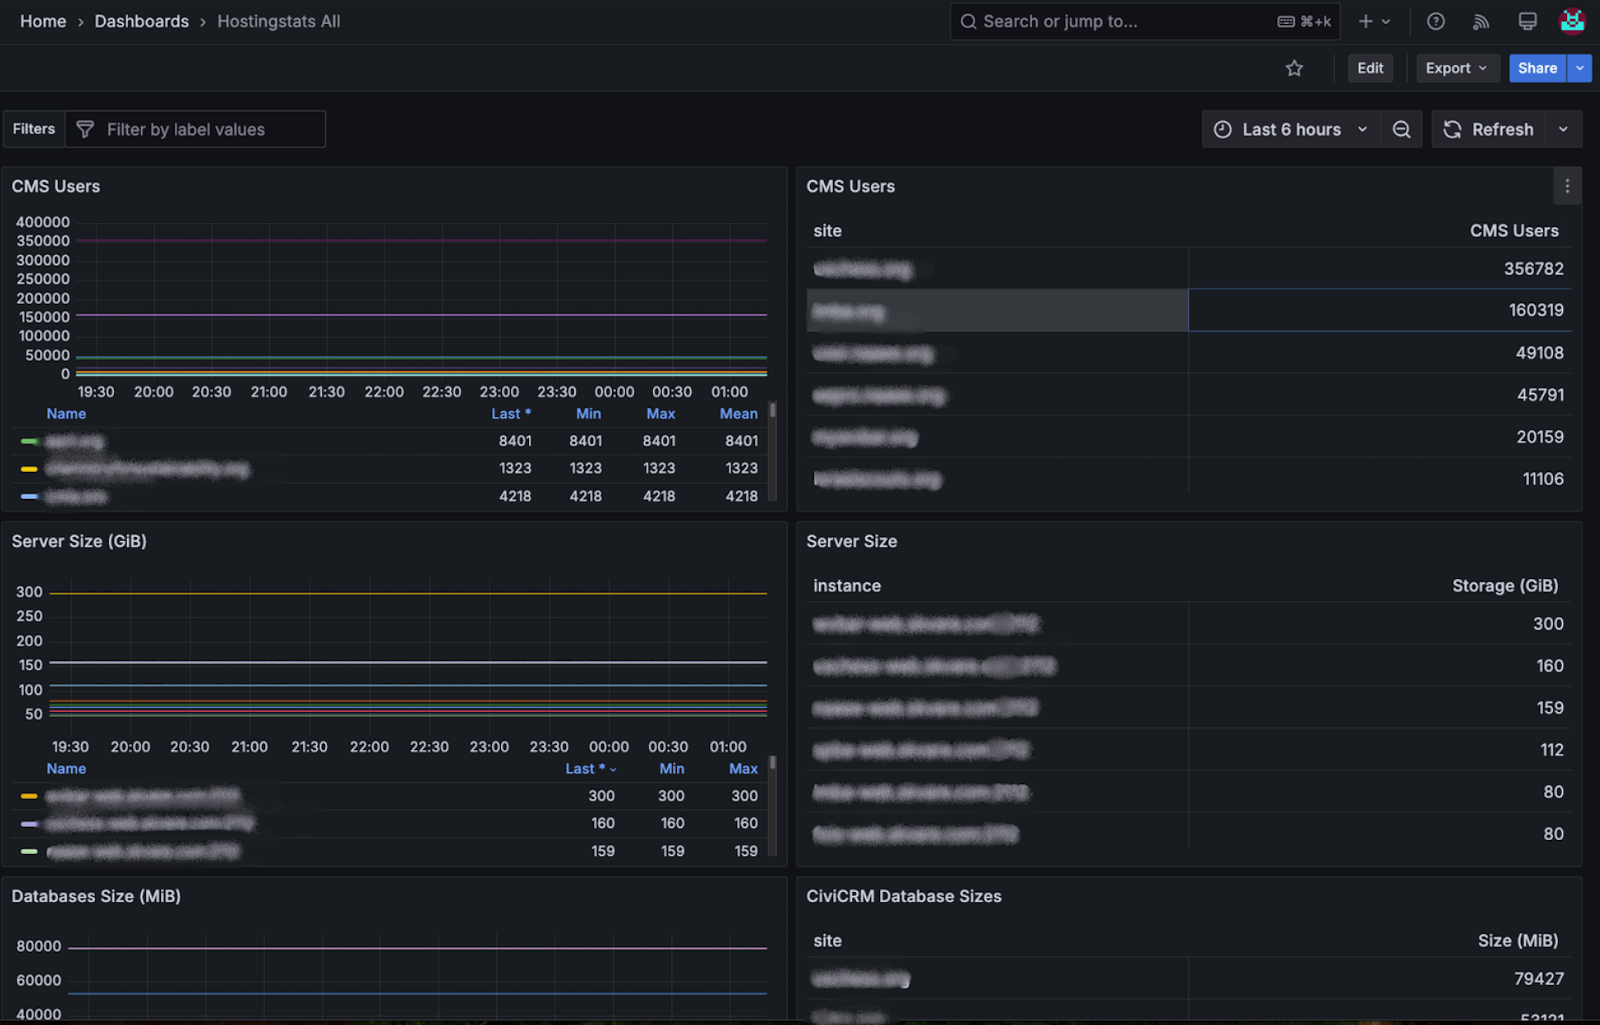
Along with netdata, we also have various internal tools we have written that export data to prometheus allowing us to look at long-term trends. We take advantage of the ease at which you can create Prometheus exporters in languages such as golang, and develop nodes that we place on individual servers to gather Drupal metrics allowing us to track metrics such as site users over time.
func drupalUsers(db *sql.DB, dbName string) (error, float64) {
  var size float64
  err := db.QueryRow(`
      SELECT COUNT(*)
      FROM ` + dbName + `.users_field_data
      WHERE status = 1
  `).Scan(&size)
  return err, size
}

func wpUsers(db *sql.DB, dbName string) (error, float64) {
  var size float64
  err := db.QueryRow(`SELECT COUNT(*) FROM ` + dbName + `.wp_users`).Scan(&size)
  return err, size
}

func dbSize(db *sql.DB, dbName string) (error, float64) {
  var size float64
  err := db.QueryRow(`
      SELECT SUM(data_length + index_length)
      FROM information_schema.tables
      WHERE table_schema = ?
      GROUP BY table_schema
  `, dbName).Scan(&size)
  return err, size
}
Custom alerts
Monitoring and displaying information is one thing, but without alerts engineers cannot respond efficiently. We use a series of mechanisms to alert our engineers:
- systemd service alerts via custom notification mechanism
Drupal cron notifications on failure and recovery
systemd provides a useful way to centralize running timers and services, but it does not provide a built-in mechanism for notifying administrators of failures.
The alerting mechanism we employ consists of two key components: a custom notification system integrated with systemd and Drupal cron job notifications. We have developed a custom solution that monitors systemd service statuses, triggering alerts to the DevOps team upon failures. This ensures quick identification and response to issues.
Additionally, we utilize Drupal cron jobs to oversee scheduled tasks, which send notifications in the event of task failures and recovery. These two approaches enable us to maintain a robust monitoring framework, ensuring our DevOps team is promptly informed.
When these services fail they also write to a "stub" on disk with a predefined naming scheme:

These files are parsed by a golang application, which exports them as JSON to be requested by a centralized dashboard which displays failures for daily checking.
cron failures also write to stub locations in order to allow us to see all cron failures across our fleet in a centralized location.
Alerts are also sent to healthchecks.io, as well as pushover, and a message is displayed in our work chat mattermost when service errors occur.
Uptime Checks
To ensure sites stay available, we monitor uptime of websites every minute using a custom python script along with a Drupal and WordPress module that presents an endpoint displaying whether the site is up, in maintenance mode, or down. If the endpoint is not available the site is implicitly down. We monitor these endpoints with a custom python application that checks websites every minute, and when failure occurs administrators are sent push notifications, an alert is also sent to the relevant team through our work chat.


Conclusion
At Skvare we take an approach similar to software regression testing. When new and unexpected failures occur that are monitoring system does not handle sufficiently, we develop new alerts that will notify us in the future if the same failure occurs or is about to occur. Unexpected failures do happen, but it gives us an opportunity to develop new mechanisms for warning and future prevention
